ETFGI reports global ETFs industry gathered net inflows of US$33.45 billion during September 2022
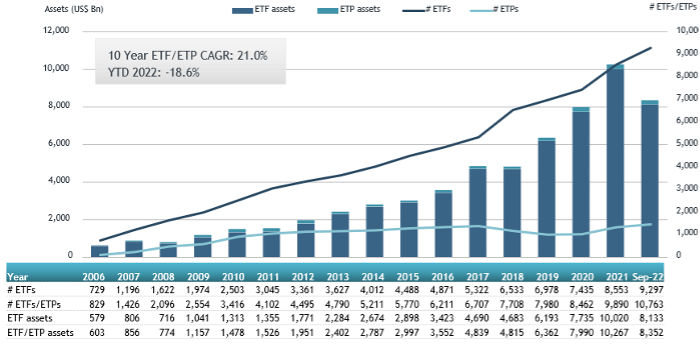
LONDON —October 19, 2022 — ETFGI, a leading independent research and consultancy firm covering trends in the global ETFs/ETPs ecosystem, reported today that the global ETFs industry gathered net inflows of US$33.45 billion during September, bringing year-to-date net inflows to US$593.20 billion. During September 2022, assets invested in the global ETFs industry decreased by 8.3%, from US$9.11 trillion at the end of August to US$8.35 trillion, according to ETFGI's September 2022 global ETFs and ETPs industry landscape insights report, the monthly report which is part of an annual paid-for research subscription service. (All dollar values in USD unless otherwise noted.)
Highlights
- Global ETFs industry gathered $33.45 Bn of net inflows during September.
- YTD net inflows of $593.20 Bn are 2nd highest on record, after 2021 YTD net inflows of $923.84 Bn.
- 40th month of consecutive net inflows.
- Assets of $8.35 Tn invested in global ETFs industry at the end of September 2022.
- Assets decreased 18.6% YTD in 2022, going from $10.27 Tn at end of 2021 to $8.35 Tn.
“The S&P 500 decreased by 9.21% in September and is down YTD by 23.87%. Developed markets excluding the US decreased by 10.07% in September and are down 27.63% YTD. Norway (down 18.96%) and Korea (down 18.78 %) saw the largest decreases amongst the developed markets in September. Emerging markets decreased by 10.23 % during September and are down 23.91% YTD. Philippines (down 16.31%) and Hungary (down 16.07%) saw the largest decreases amongst emerging markets in September.” According to Deborah Fuhr, managing partner, founder and owner of ETFGI.
Global ETF and ETP assets as of the end of September 2022
The Global ETFs industry had 10,763 products, with 22,235 listings, assets of $8.35 Tn, from 657 providers on listed 79 exchanges in 63 countries at the end of Q3.
During September, ETFs/ETPs gathered net inflows of $33.45 Bn. Equity ETFs/ETPs gathered net inflows of $18.99 Bn during September, bringing YTD net inflows to $334.81 Bn, lower than the $632.31 Bn in net inflows equity products had attracted at this point in 2021. Fixed income ETFs/ETPs gathered net inflows of $9.73 Bn during September, bringing YTD net inflows to $148.12 Bn, lower than the $174.18 Bn in net inflows fixed income products had attracted by the end of September 2021. Commodities ETFs/ETPs reported net outflows of $5.63 Bn during September, bringing YTD net outflows to $7.26 Bn, less than the $9.55 Bn in net outflows commodities products had reported year to date in 2021. Active ETFs/ETPs attracted net inflows of $8.80 Bn over the month, gathering net inflows YTD of $88.82 Bn, lower than the $110.65 Bn in net inflows active products had reported YTD in 2021.
Substantial inflows can be attributed to the top 20 ETFs by net new assets, which collectively gathered $47.99 Bn during September. SPDR S&P 500 ETF Trust (SPY US) gathered $6.33 Bn, the largest individual net inflow.
Top 20 ETFs by net new inflows September 2022: Global
|
Name |
|
Ticker |
Assets |
NNA |
NNA |
|
SPDR S&P 500 ETF Trust |
|
SPY US |
330,238.74 |
(23,235.08) |
6,327.99 |
|
SPDR Bloomberg Barclays 1-3 Month T-Bill ETF |
|
BIL US |
24,599.98 |
10,987.18 |
5,886.80 |
|
iShares MSCI USA ESG Enhanced UCITS ETF |
|
EEDS LN |
9,780.95 |
6,503.63 |
4,711.66 |
|
Vanguard S&P 500 ETF |
|
VOO US |
241,660.23 |
36,508.88 |
3,435.58 |
|
iShares 1-3 Year Treasury Bond ETF |
|
SHY US |
28,483.31 |
9,095.61 |
3,429.44 |
|
iShares Short Treasury Bond ETF |
|
SHV US |
23,369.18 |
10,268.83 |
2,614.19 |
|
Vanguard Total Stock Market ETF |
|
VTI US |
236,563.99 |
19,216.96 |
2,521.83 |
|
ProShares UltraPro QQQ |
|
TQQQ US |
10,284.10 |
10,186.08 |
2,226.25 |
|
China AMC China 50 ETF |
|
510050 CH |
8,629.47 |
515.17 |
1,995.37 |
|
iShares MSCI USA Min Vol Factor ETF |
|
USMV US |
27,287.23 |
2,558.73 |
1,694.31 |
|
WisdomTree Floating Rate Treasury Fund |
|
USFR US |
9,736.25 |
7,899.22 |
1,684.47 |
|
iShares MSCI EAFE Min Vol Factor ETF |
|
EFAV US |
6,635.96 |
503.79 |
1,616.13 |
|
iShares 0-3 Month Treasury Bond ETF |
|
SGOV US |
4,792.91 |
4,048.11 |
1,532.14 |
|
Huatai-Pinebridge CSI 300 ETF |
|
510300 CH |
7,198.73 |
931.89 |
1,358.19 |
|
Schwab US Dividend Equity ETF |
|
SCHD US |
35,210.17 |
10,967.28 |
1,271.10 |
|
NEXT FUNDS Nikkei 225 Leveraged Index ETF |
|
1570 JP |
2,727.61 |
(67.09) |
1,249.97 |
|
iShares Treasury Floating Rate Bond ETF |
|
TFLO US |
3,420.84 |
3,072.57 |
1,194.40 |
|
Vanguard Russell 1000 Growth |
|
VONG US |
7,672.21 |
2,154.01 |
1,124.81 |
|
JPMorgan Equity Premium Income ETF |
|
JEPI US |
12,592.89 |
8,851.76 |
1,058.42 |
|
iShares Core S&P 500 ETF |
|
IVV US |
265,168.83 |
16,763.97 |
1,056.78 |
The top 10 ETPs by net new assets collectively gathered $1.24 Bn over September. WisdomTree Physical Gold - EUR Daily Hedged - Acc (GBSE GY) gathered $308.26 Mn, the largest individual net inflow.
Top 10 ETPs by net new inflows September 2022: Global
|
Name |
|
Ticker |
Assets |
NNA |
NNA |
|
|
GBSE GY |
295.87 |
308.26 |
308.26 |
|
|
iShares Silver Trust |
|
SLV US |
9140.94 |
(746.54) |
294.12 |
|
ProShares Ultra DJ-UBS Natural Gas |
|
BOIL US |
294.41 |
(19.92) |
174.32 |
|
ProShares Ultra DJ-UBS Crude Oil |
|
UCO US |
724.72 |
(856.47) |
77.65 |
|
Invesco CurrencyShares Euro Currency Trust |
|
FXE US |
388.68 |
215.08 |
72.85 |
|
Invesco CurrencyShares British Pound Sterling Trust |
|
FXB US |
160.91 |
70.61 |
71.27 |
|
MicroSectors FANG Innovation 3X Leveraged ETN |
|
BULZ US |
207.74 |
504.03 |
69.71 |
|
MicroSectors FANG+ Index 3X Leveraged ETNs due January 8, 2038 |
|
FNGU US |
530.42 |
313.64 |
63.19 |
|
United States Oil Fund LP |
|
USO US |
1948.93 |
(1,054.54) |
57.22 |
|
WisdomTree Brent Crude Oil - Acc |
|
BRNT LN |
206.66 |
(121.99) |
46.48 |
Investors have tended to invest in Equity ETFs/ETPs during September.
Contact deborah.fuhr@etfgi.com if you have any questions or comments on the press release or ETFGI events, research or consulting services.
##
|
|
|
|
|


 ETFGI is supporting